
Deep Intelligence.
Deep Intelligence brings the data from all your channels together in one place. Virtual CMO, your virtual marketing manager, reads it and suggests the actions worth considering.
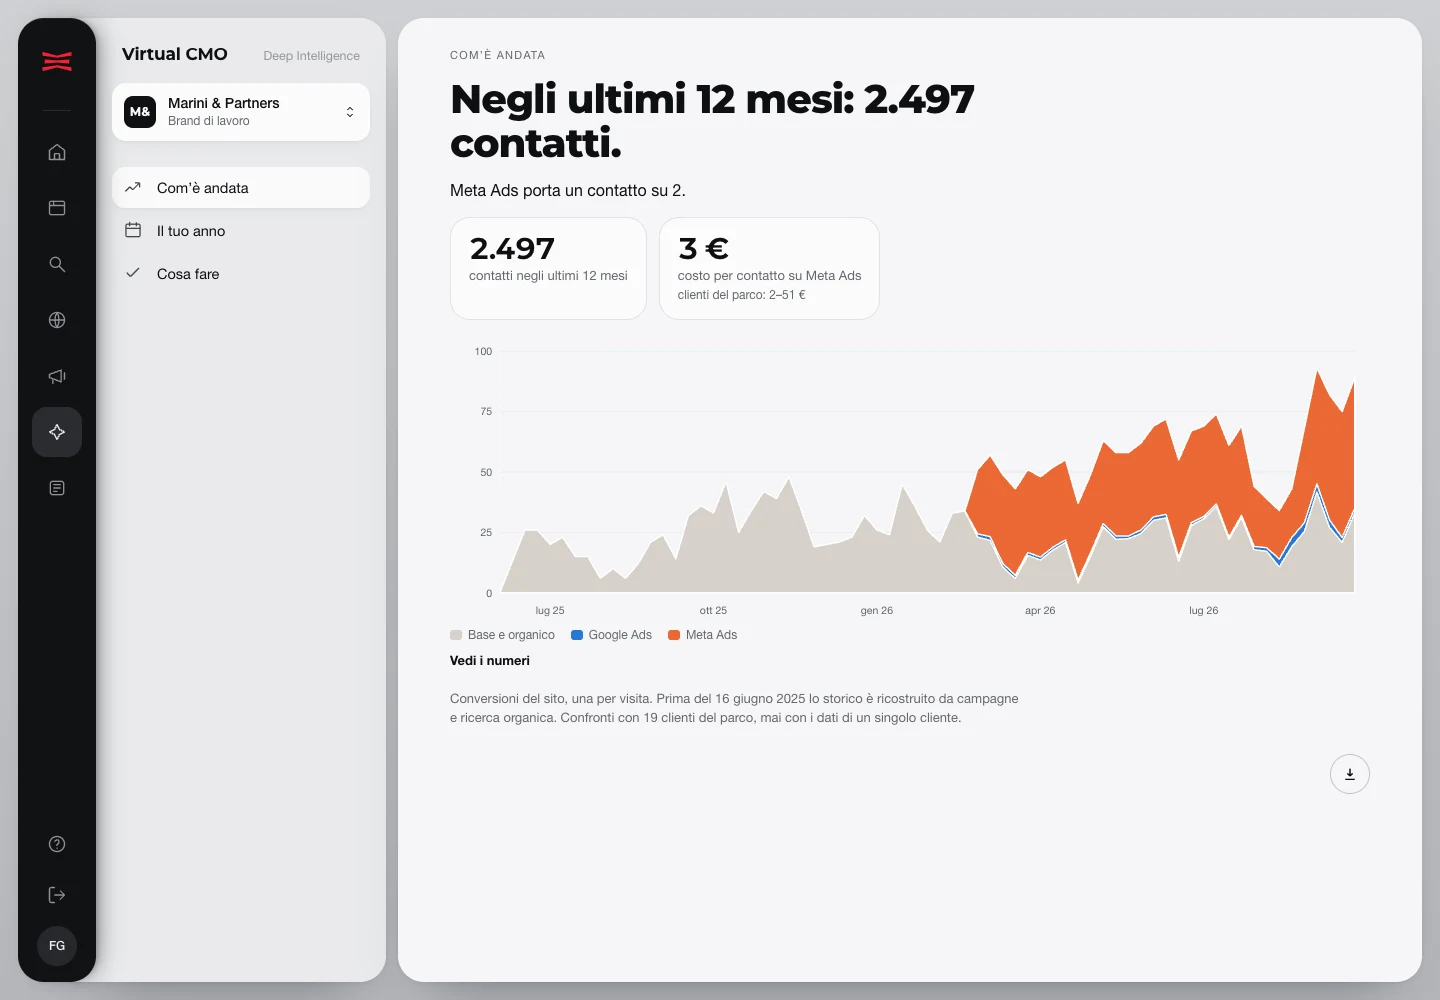
From channels to forecasts.
Deep Intelligence brings together the data from your channels over the same period. Virtual CMO uses it to estimate how much your next investments can return.
- Your website
- Search Console
- Google Ads
- Meta Ads
- ChatGPT Ads
- ChatGPT, Gemini, Perplexity
- Social
- Newsletter
- Press and influencers
- Website chatbot
Forecasts
It forecasts up to 26 weeks ahead, if on past data the model has done better than a simple estimate.
What you read for each source
- Your website
- Track visits and leads, without cookies.
- Search Console
- Find the Google searches and the pages that bring you visits.
- Google Ads
- Compare what you spend with how many leads or sales each campaign brings.
- Meta Ads
- See what you pay for a result on Facebook and Instagram.
- ChatGPT Ads
- Measure spend, clicks and results of your ads on ChatGPT.
- ChatGPT, Gemini, Perplexity
- Check whether AI assistants mention you or your competitors.
- Social
- Follow audience growth and post results.
- Newsletter
- Check deliveries, subscribers and unsubscribes.
- Press and influencers
- Find the articles published about you and what the same space would cost to buy in the press.
- Website chatbot
- Find out what visitors ask your website’s chatbot.
Go from data to decisions.
You see the website, search and campaigns in the same dashboard. The screens show the Marini & Partners demo site, with test data.
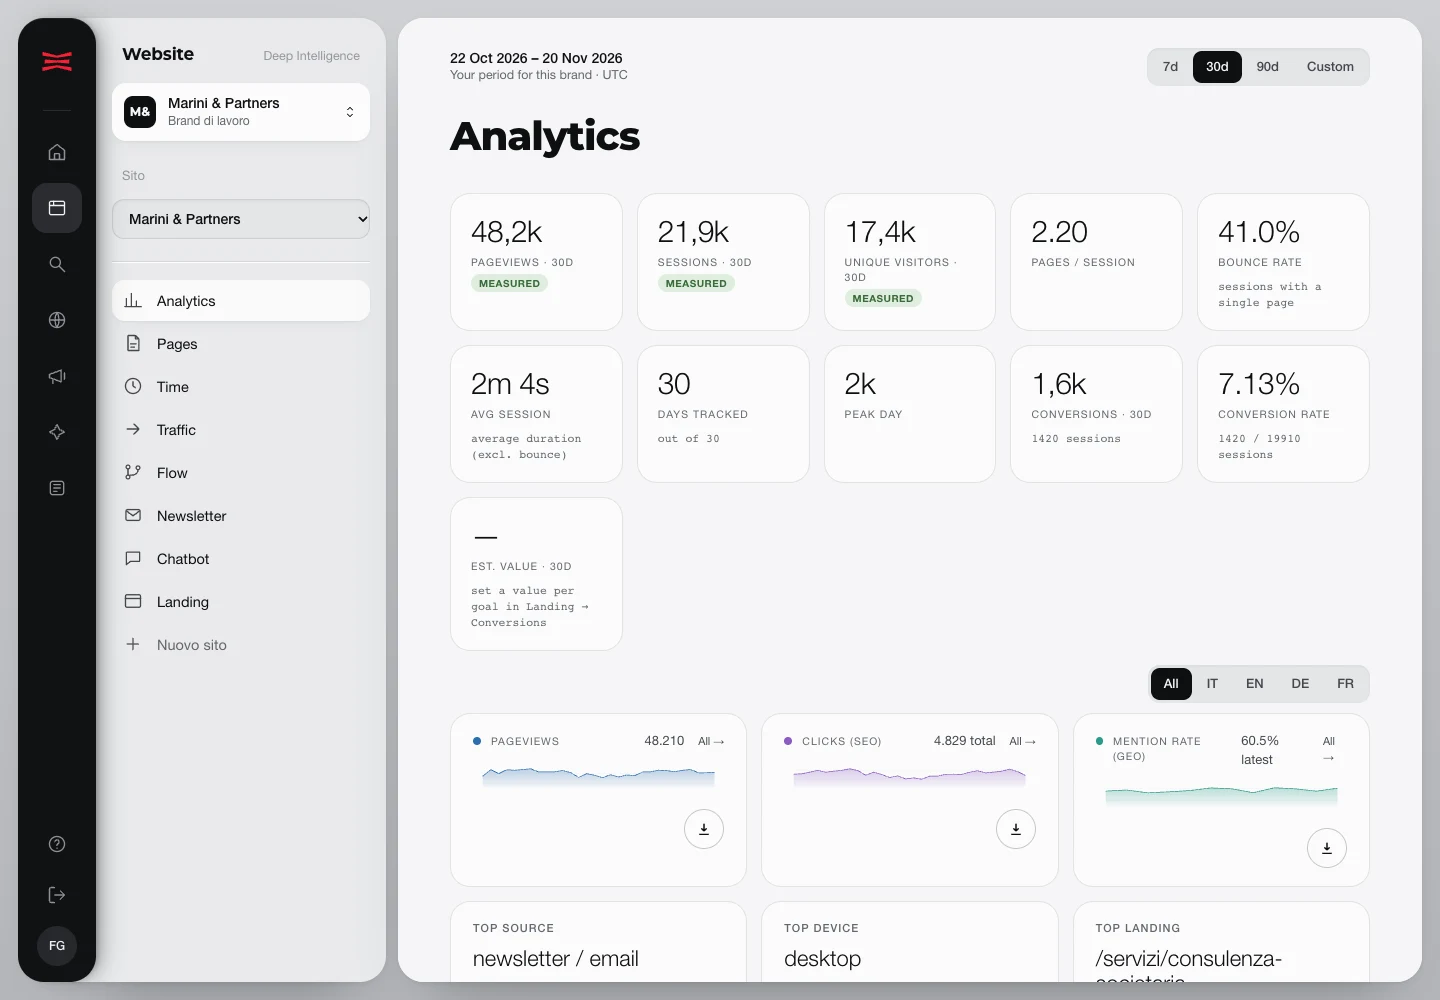
See leads next to website visits.
The Website view counts visits, page views and conversions, meaning leads and sales, over the whole period, without following individual people. Below you find the trend of visits from Google and from AI assistants, so you notice right away if one of the two channels goes up or down.
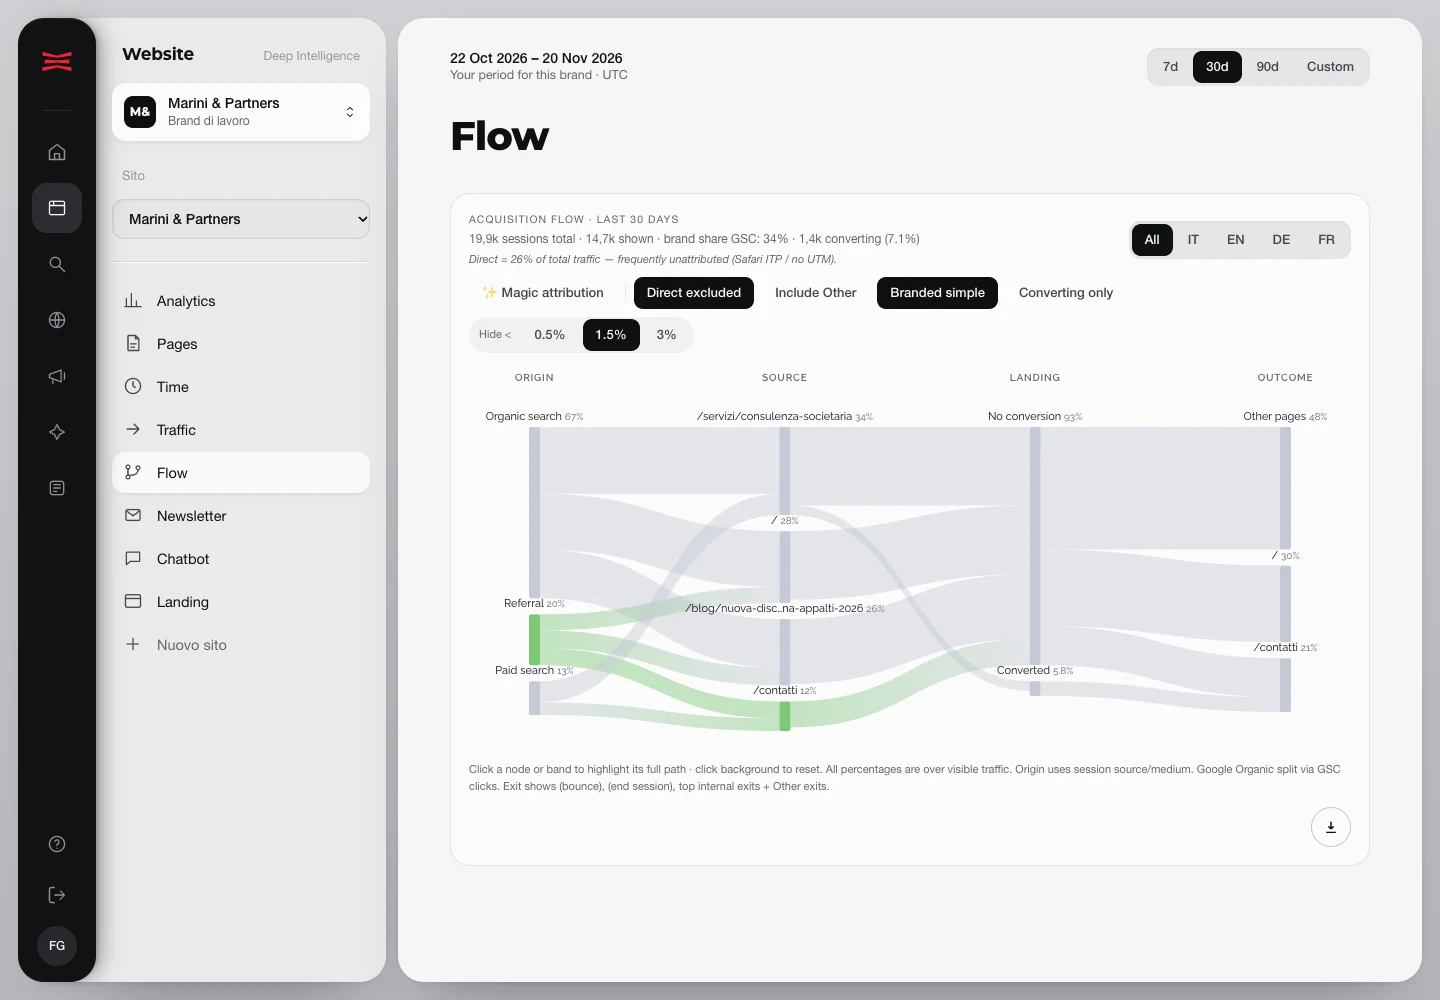
Compare sources, pages and leads.
You compare how many visits and how many leads come from each source and each page. Magic Attribution estimates where part of the direct visits come from, meaning the ones that tools record without a source.
Read Search Console even if it is not your job.
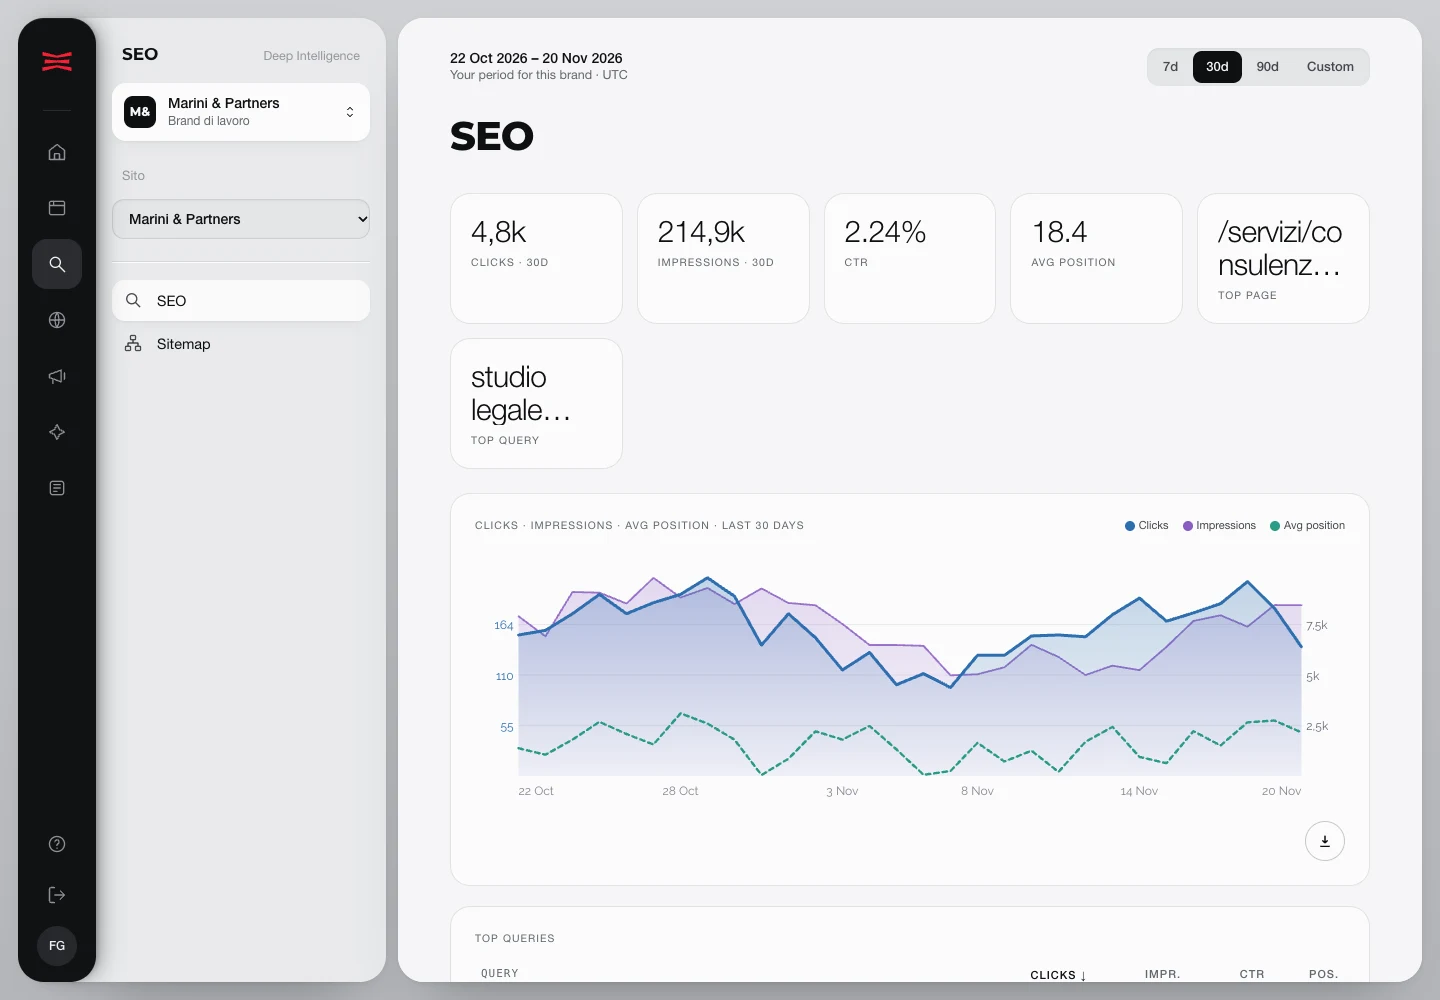
The SEO view tells you how many times the website appears on Google, how many people click, your average position and which searches and pages bring visits. It then compares the list of the website’s pages with Google’s data, so you see which pages Google shows, which it never shows and which steal visits from each other.
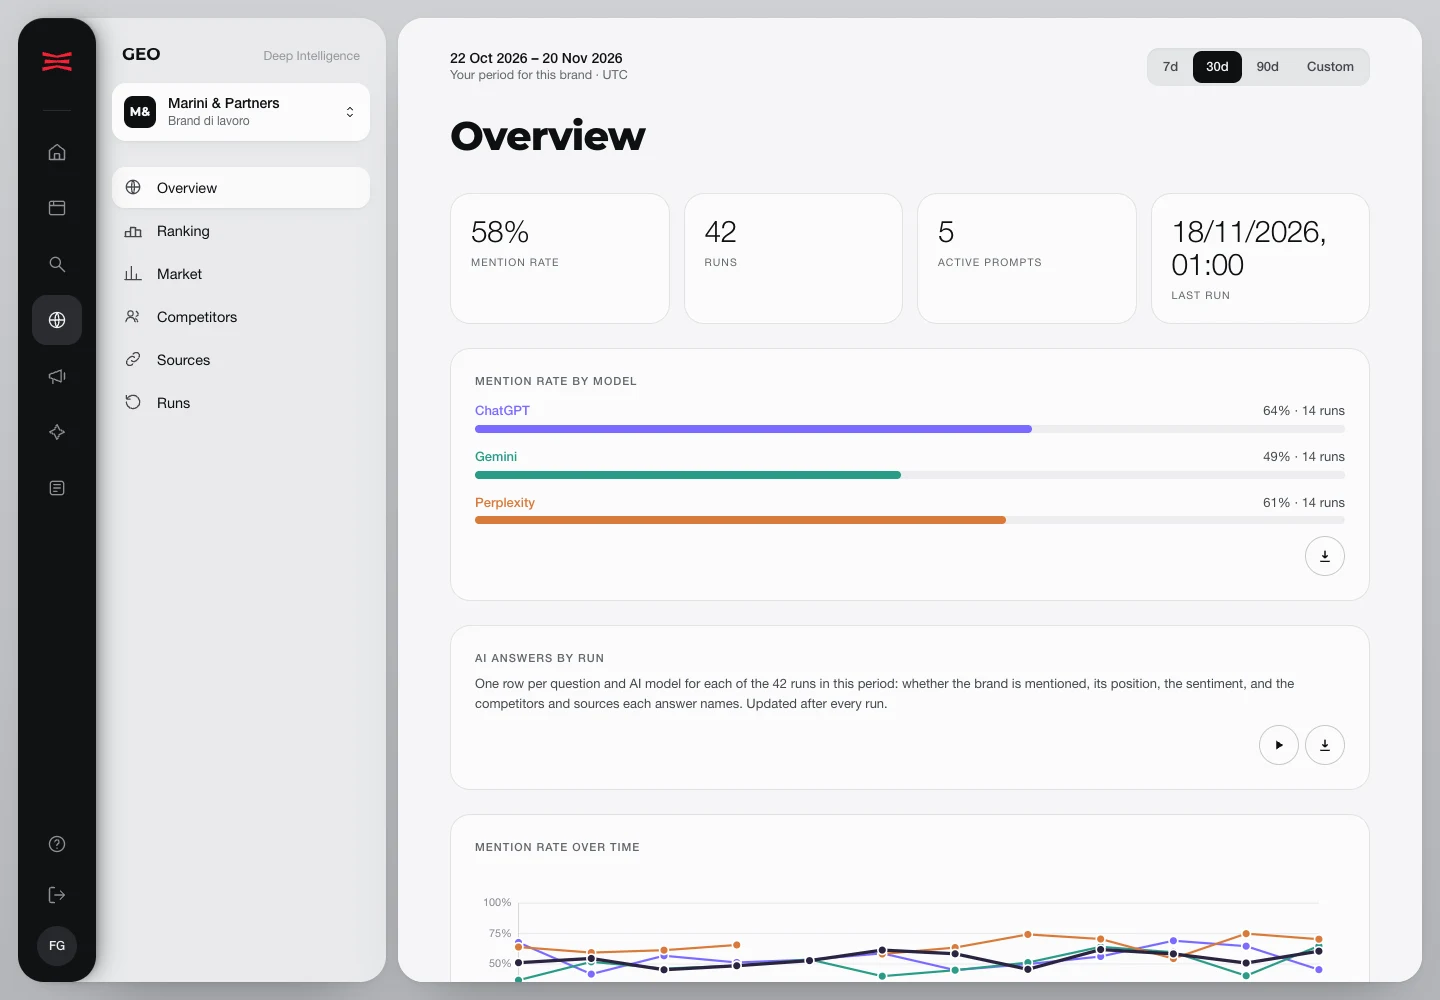
Check whether AI assistants mention you.
At regular intervals the GEO view asks ChatGPT, Gemini and Perplexity the questions your customers ask. It shows how many times you appear in each one’s answers, so over time you see whether you appear more or less often.
Follow spend week by week.
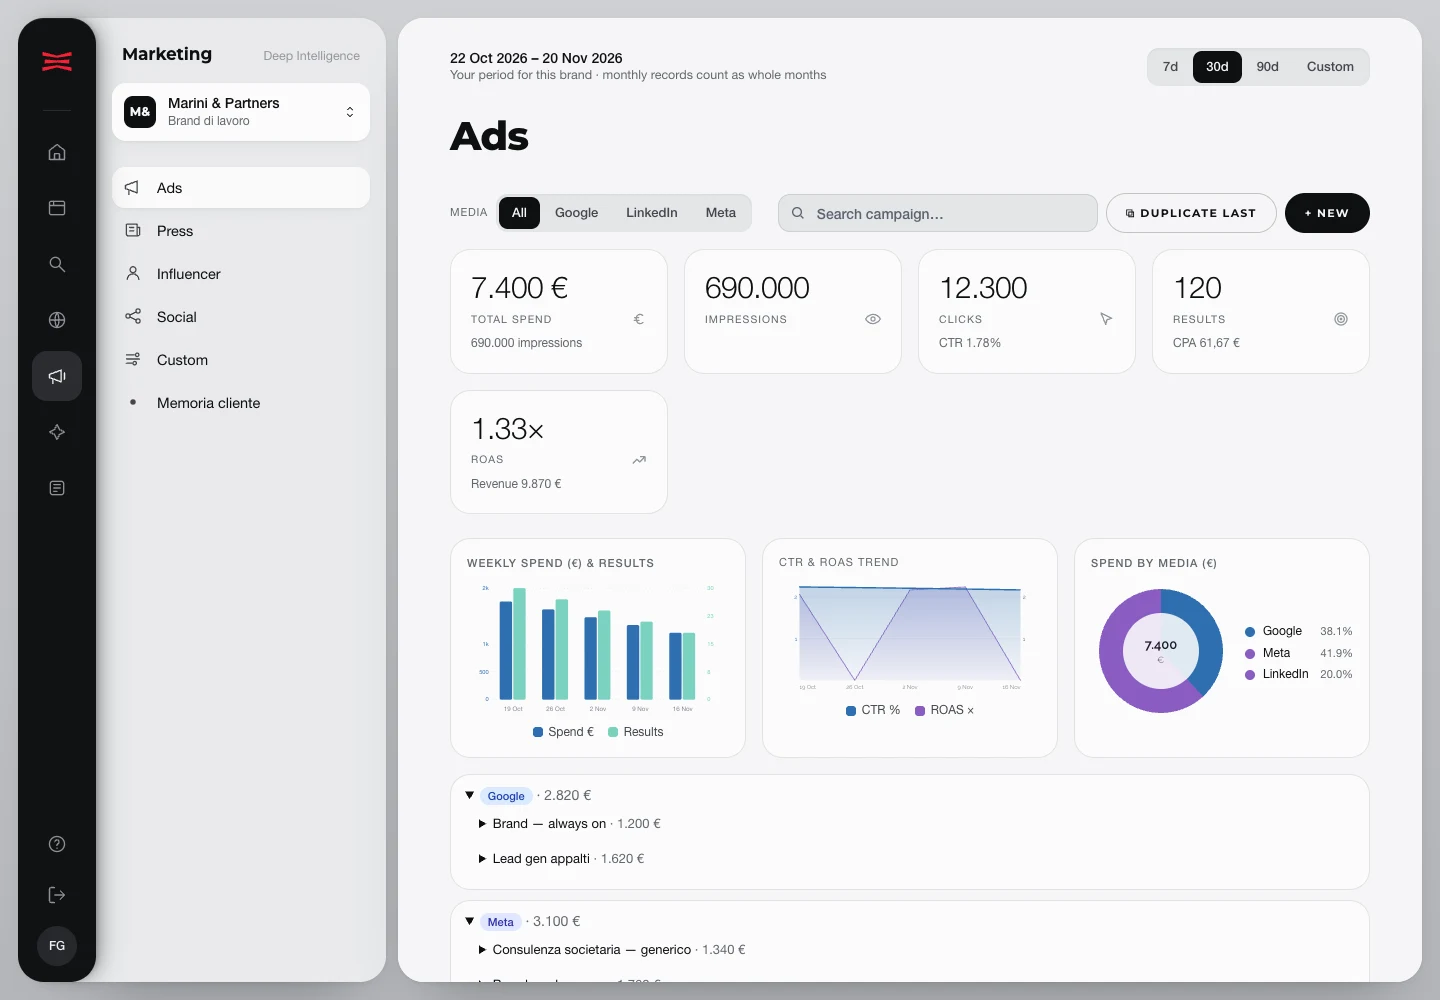
The Marketing view lines up, campaign by campaign and over the same days, spend, impressions, clicks, results and ROAS for Google and Meta. ROAS tells you how many euros of sales each euro spent brings in. In the same view you find press, influencers and social media, so next to every cost you see its result.
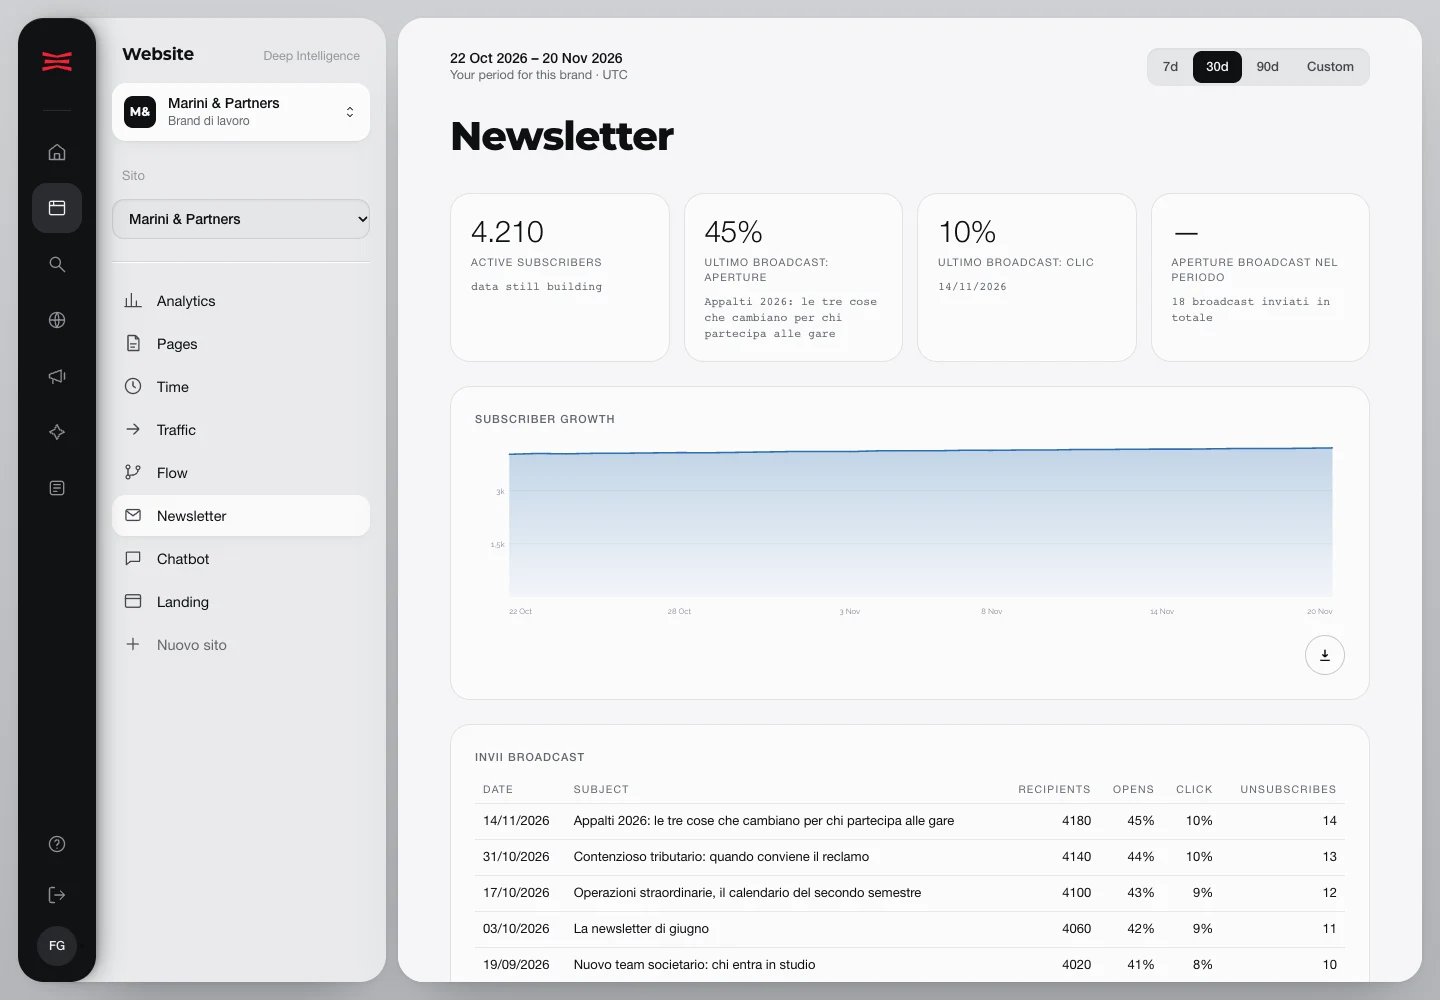
Follow sends and list growth.
Read subscribers, deliveries and unsubscribes. For new sends you count total opens and clicks, without knowing who opened or clicked.
Understand where leads come from.
Deep Intelligence discards the visits from automated programs it recognises and the ones counted twice, then gives the same name to sources that arrive written in different ways. Magic Attribution estimates how many direct visits, meaning visits without a source, actually come from Google, AI assistants and other channels, with rules and limits we show you.
You compare the results the ad platforms report with the leads and sales your website actually records. You can switch off the estimate of direct visits and look at the original data.
- Remove the visits from automated programs the system recognises.
- Count once a visit that arrives twice, from the browser and from the server.
- Compare sources that always carry the same name.
- Tell the leads recorded on the website apart from the estimated ones.
Virtual CMO suggests where to act.
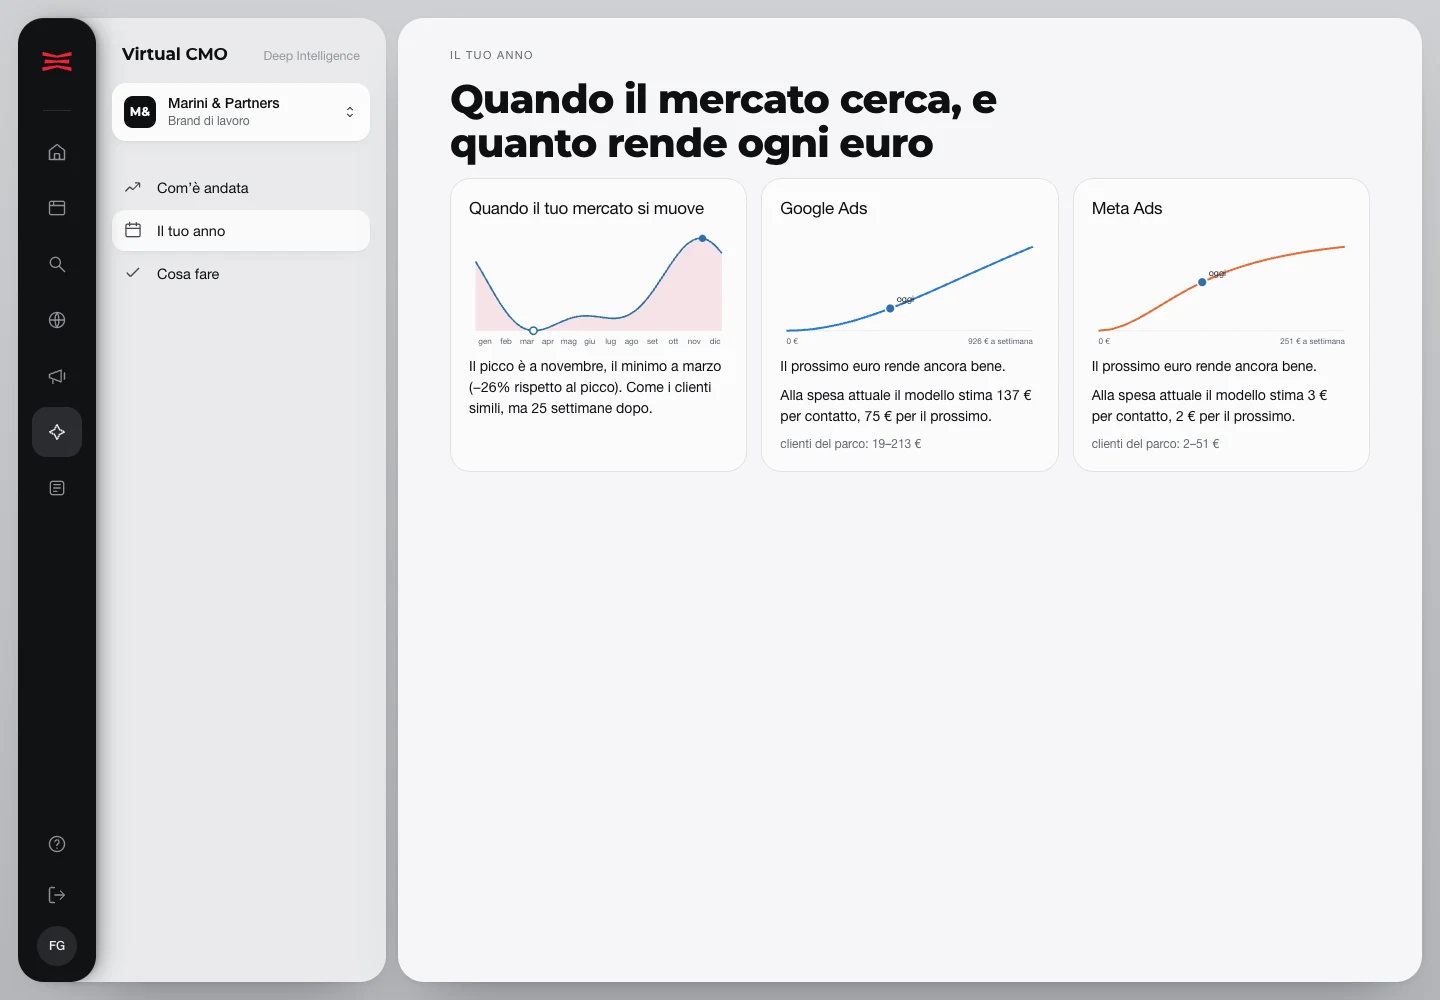
Your brand’s statistical model separates the leads that would have come anyway, seasonality included, from the ones each channel brings. For each channel it calculates how long the effect of spend lasts and from what amount an extra euro starts to return less.
Every Monday Virtual CMO reads the model and suggests the actions worth considering, with how many extra leads each should bring and how much work it takes. You decide what to do. After eight weeks you compare the result with the forecast.
- Weigh how to split the budget across channels.
- Choose the pages to work on to climb on Google.
- Compare changes to campaign landing pages with the work to appear in AI answers.
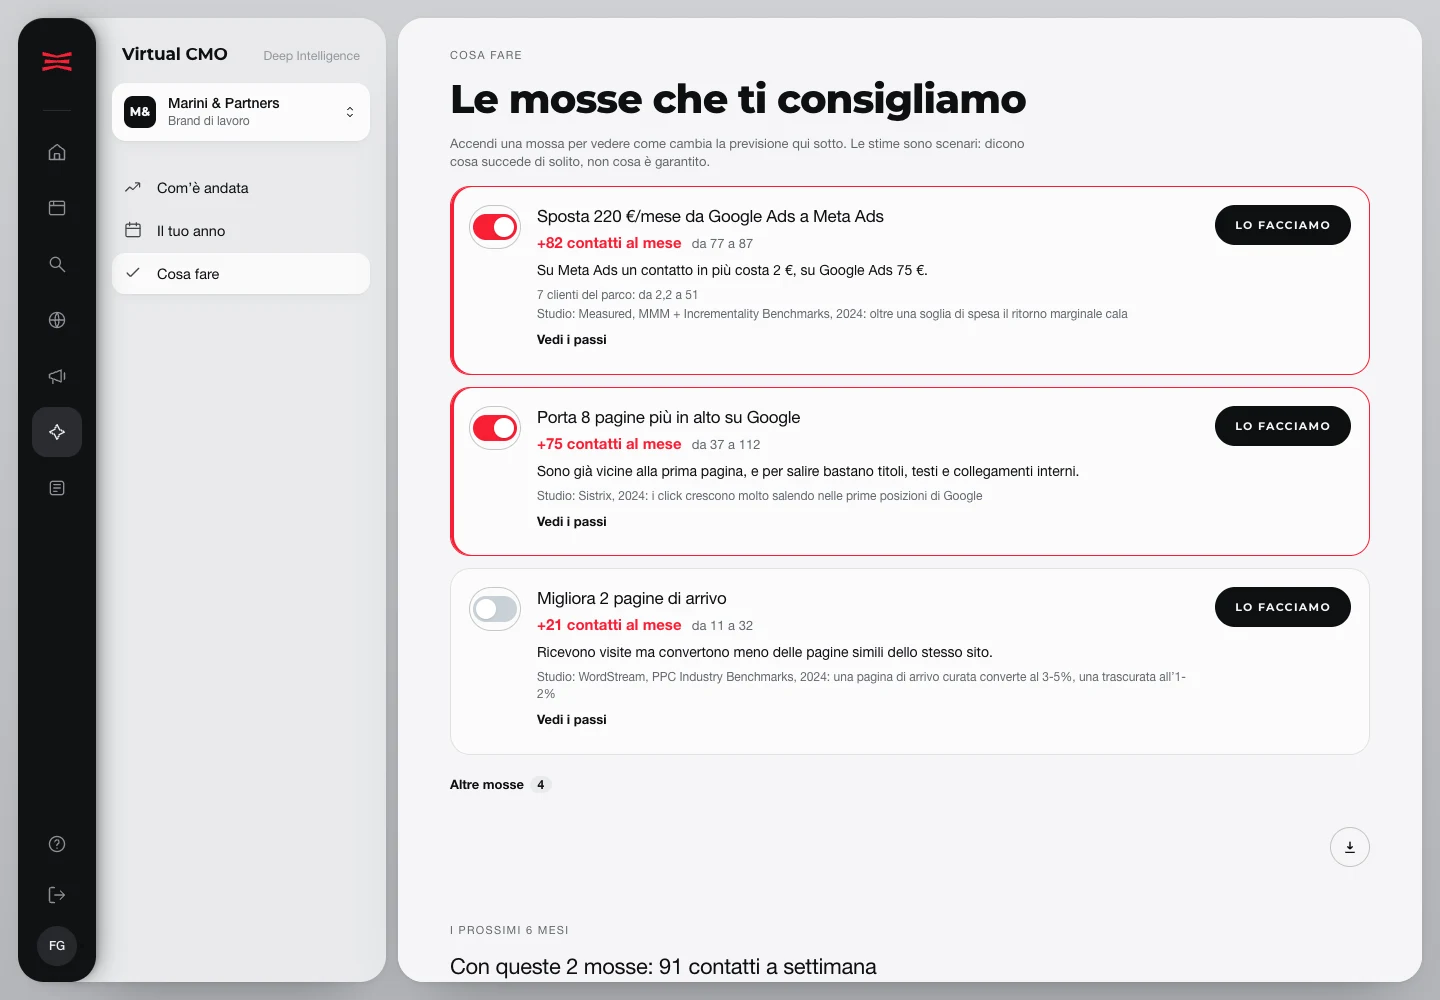
Weigh your next investment.
In the dashboard each channel has its own curve, showing where you are today, what a lead costs you now and what the next one will cost, compared with the figures of companies similar to yours.
To forecast twenty-six weeks the model needs at least twenty-six weeks of past data. The forecast appears only if, over the last eight weeks, it has done better than a simple estimate. If you have little data, the model can use data from groups of at least four similar brands, without showing any single client’s data.
Connect your website and the sources you use.
- Website and privacy
- The code you add to your website counts visits per day and per page, without cookies or IP addresses, without rebuilding individual visitors’ sessions and without linking an action to a person. It respects Do Not Track and Global Privacy Control, the settings a visitor uses to ask not to be tracked. Your website’s privacy policy describes this count.
- Campaigns and search
- Deep Marketing connects the sources your project includes. The team enters LinkedIn Ads, TikTok Ads, press and influencer data by hand.
- Access and export
- You access the dashboard with your team. You can export every table to CSV, the format you open in Excel, so you keep the numbers outside the platform too.
Bring the numbers into your decisions.
- If you run the company
- You compare what you spend with the results you get, without pulling together reports from different tools.
- If you run marketing
- You set the quarter’s priorities with channel data and Virtual CMO’s suggestions side by side.
Answers before the demo.
How is Deep Intelligence activated?
We at Deep Marketing activate it: we connect the sources and give your team access. The proposal lists the features included, while monitoring your presence in AI (GEO) is a separate service.
Does it replace Google Analytics and Looker Studio?
It covers visits, sources, pages and conversions. You can keep GA4 alongside it for the more specialised features. Deep Intelligence views have a fixed layout, so you cannot build free-form reports as in Looker Studio.
What do I see in the demo?
You see the product on the Marini & Partners demo site, with test data. We match the views with the questions you want to answer about your channels.
What changes for people already using the app?
The dashboard stays at intelligence.deepmarketing.it. You keep the same access and your data.
Where can I read more?
The Deep Intelligence guides are now part of the Deep Marketing blog. The old addresses lead straight to the transferred articles.
See where your budget can work harder.
Request a demo: we walk through the demo dashboard and the sources you use, then decide what to connect for your project.
